Ru
 Our channel
T-Investments
We moved the bond selection process from dozens of scattered services into a single terminal interface. We designed a widget that combined quotes, filtering, analytics, ratings and market dynamics in one window.
The interface for bonds means dozens of parameters, milliseconds to make decisions and an eternal battle with information noise. At ZHIRNOV Studio, we argued over every pixel to make one widget in the T-Investments terminal replace five open tabs for a trader. Here's how it went.
What we worked on
The terminal at T-Investments is a web service for exchange trading from a computer. It serves as an alternative to the mobile app and provides a more flexible and professional environment for transactions. The main feature of the product is that the interface can be assembled from widgets, analyze charts, work with the "order book" and quickly execute trades. If you're far from the world of securities, the order book is not a glass of brandy as a gift from the service for nerves spent on trades, but one of the terminal's key tools. A table that shows limit orders to buy and sell an asset in real time and helps assess liquidity, see the balance of supply and demand, and understand market behavior.
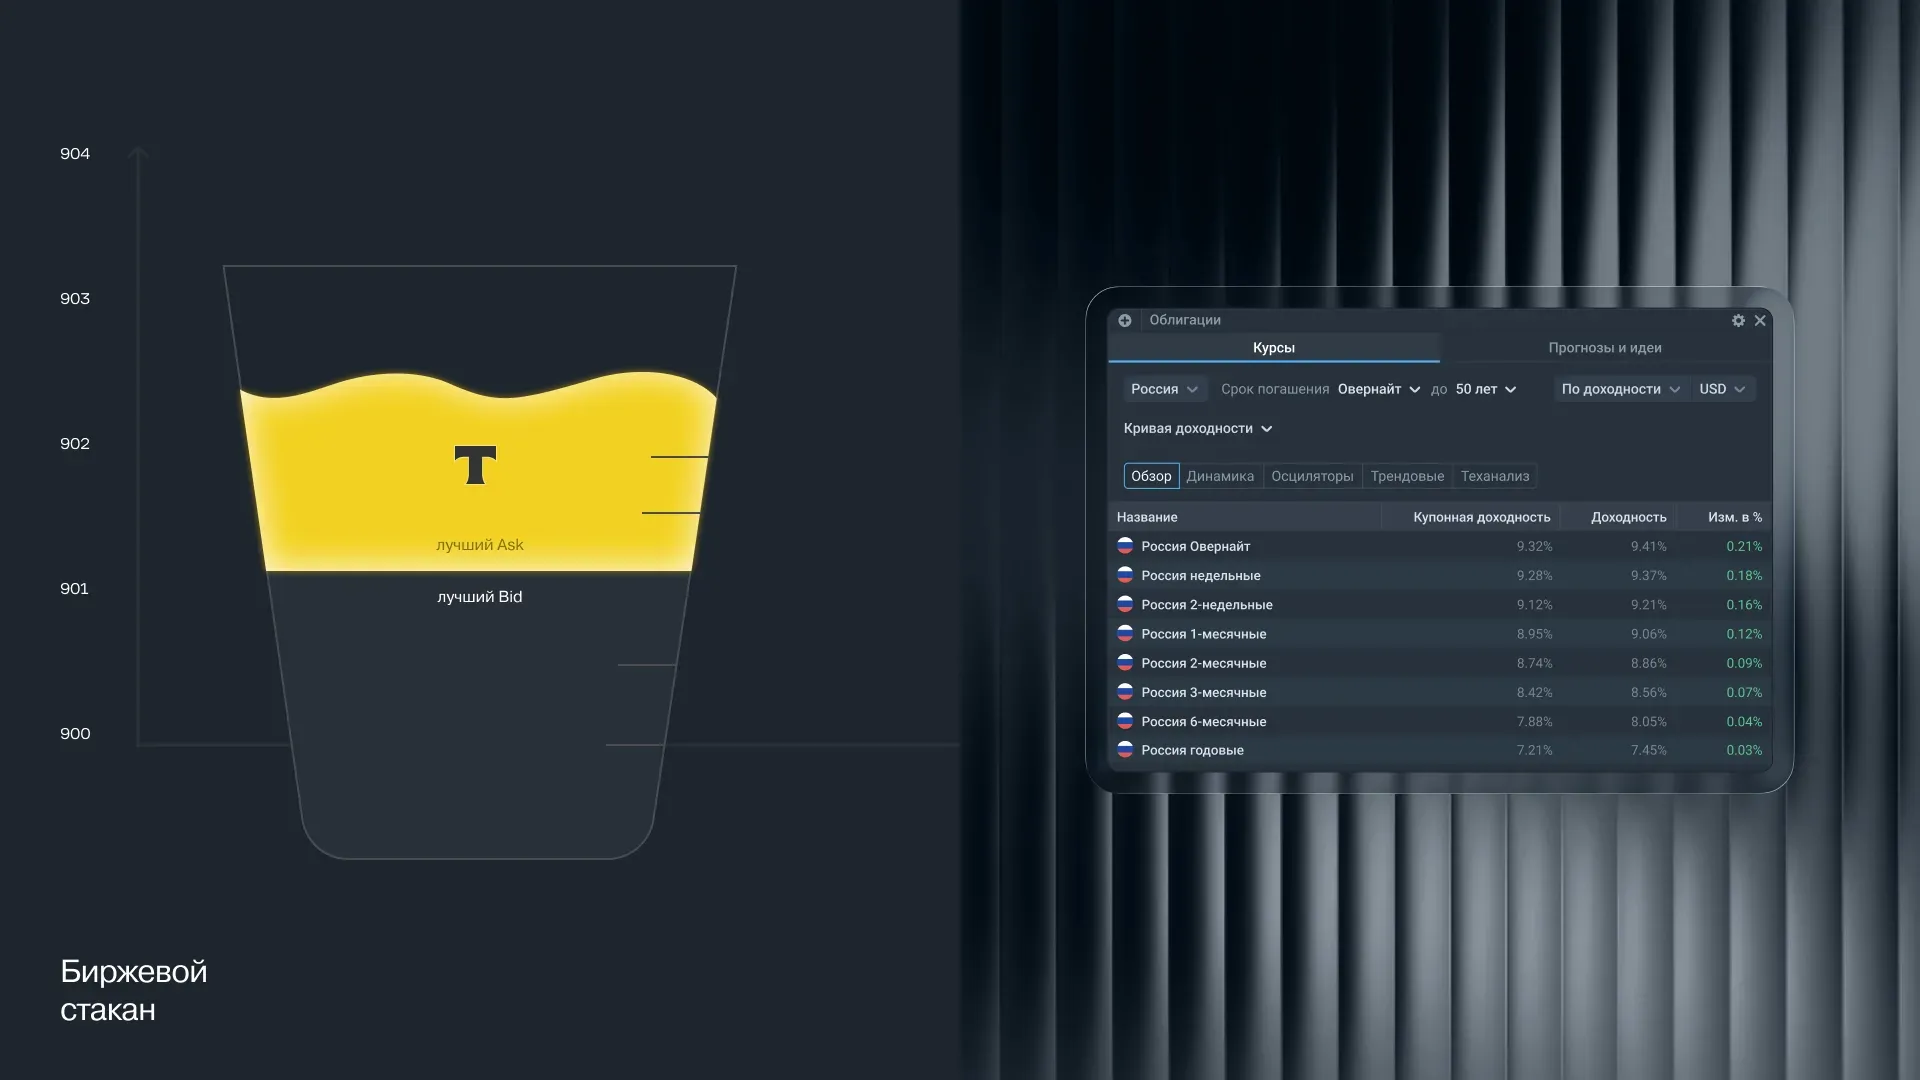
The terminal is generally generous with analytics: stocks, bonds, funds, indices, analyst ideas — take what you want. And we at ZHIRNOV Studio made the widget specifically for bonds back in the day. To be honest, it was a long time ago — when T-Bank was still named after its founder. But the work turned out so great that we finally matured enough to share it.
One widget — but several weeks of work
The bond widget is needed to help users quickly navigate this asset class and find suitable investment opportunities. Important: searching for and buying bonds is more complex than stocks because they require accounting for several parameters at once: yield, maturity date, currency and geography.
Therefore, the widget needed to provide:
1. Quick access to current quotes;
2. Clear viewing and comparison of bonds;
3. Filters by key parameters: maturity, yield, currency and country;
4. Ready-made selections, for example, top bonds for Russia and other markets.
The task was to integrate a huge layer of complex information into a compact tool. And at the same time, make it fit organically into the terminal rather than look like a separate alien module.
Our analytics would make DiCaprio jealous
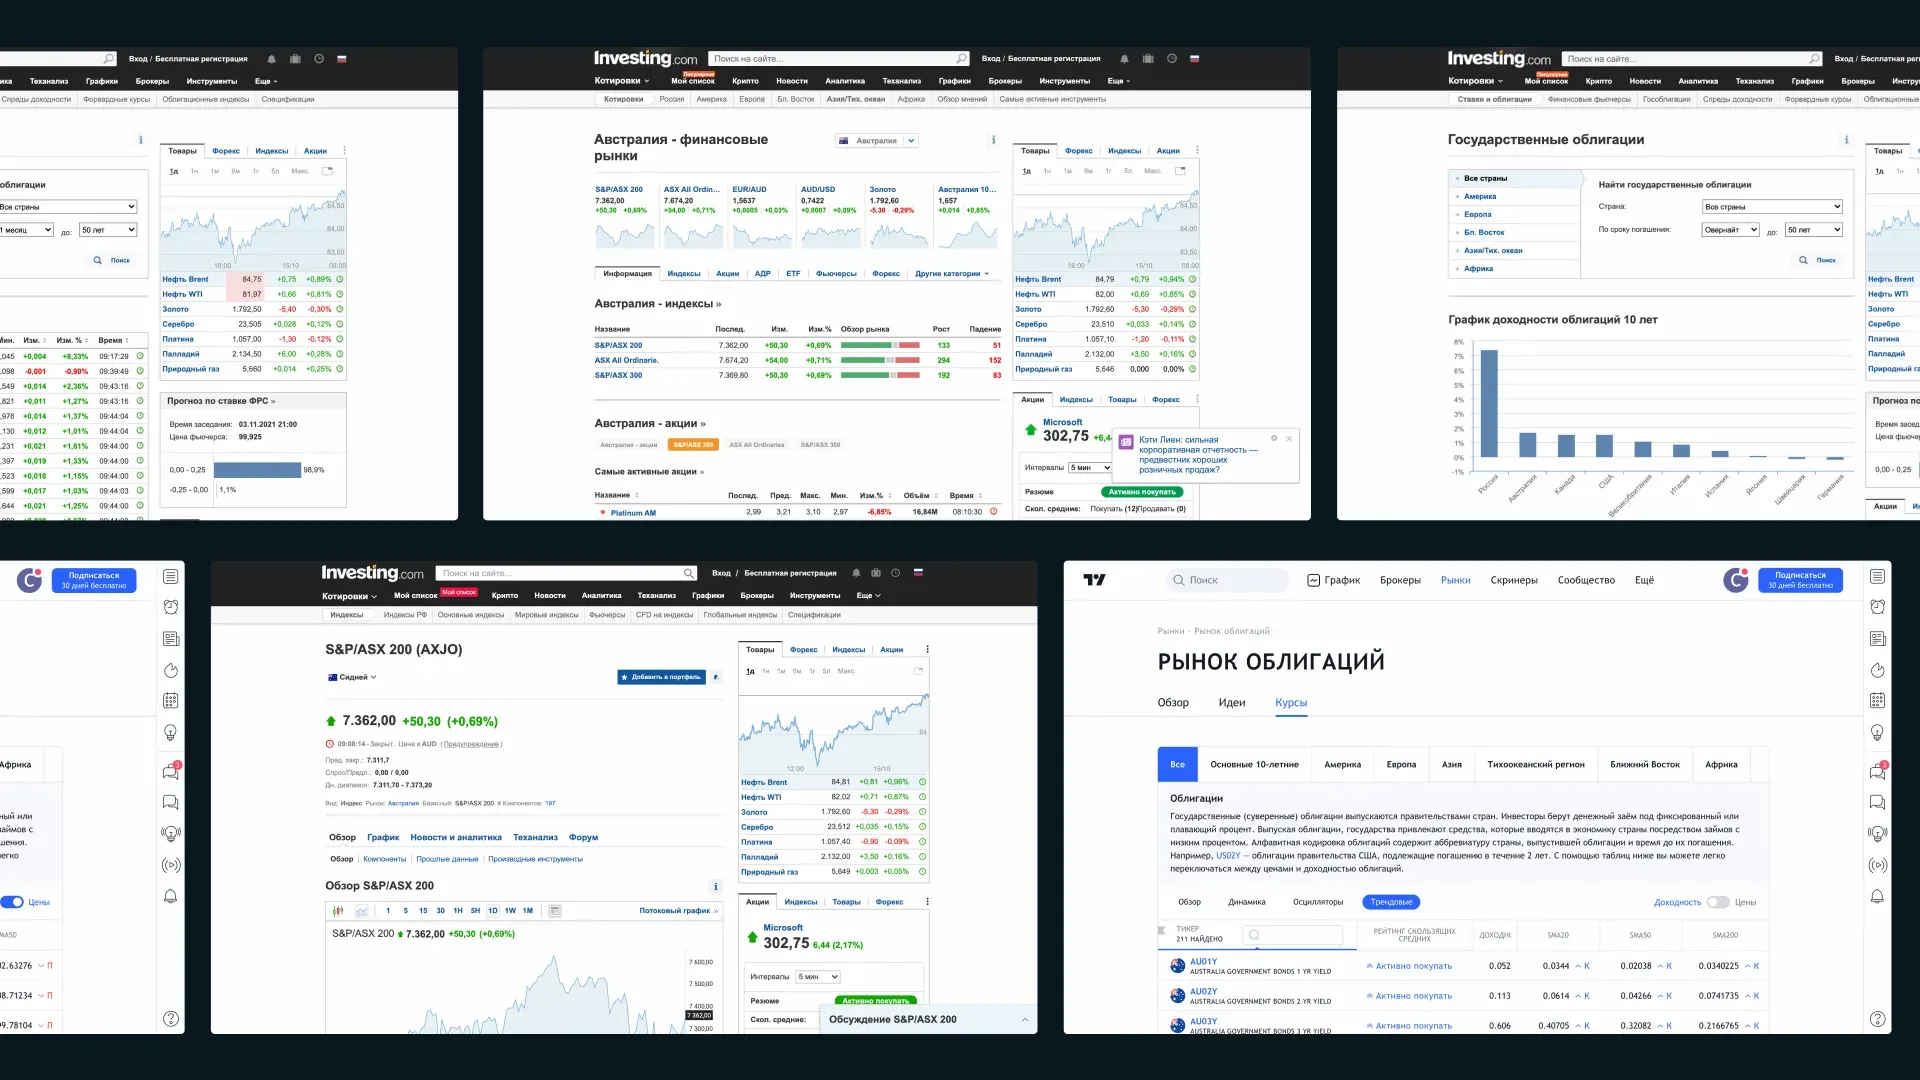
We started by studying how people actually make investment decisions and what they use in the process. We even rewatched "The Wolf of Wall Street," but strictly for work purposes. Then we conducted competitive analysis. We looked at Investing.com: saw how they present government bonds, tops and bond cards. On TradingView we looked at how charts and technical analysis are organized specifically for bonds.
And for dessert — a broader perspective. We found references in visualizing market movements: how they show asset growth and decline, where the eye catches first, and where the interface starts hogging the blanket.
You can't build an investment portfolio without analytics. The user needs news, reviews, charts, quotes, volumes — everything at once.
Previously, traders jumped between services and spent hours on it. But T-Bank's approach is this: investments should be accessible not only to professionals, but to everyone.
So we needed not just to dump all the indicators into one widget, but to make it convenient. So that in a couple of seconds you understand the market situation, and if you want, dive into details. Special attention to accessibility. We looked for examples even outside fintech. Like an airport board: dozens of flights, delays, boarding gates — but a passenger understands everything at first glance. We needed the same.
The terminal is a product for insiders. There are almost no random people there. But even a prepared user shouldn't stumble over the interface. A good tool immediately gives answers to basic questions: what's growing, what's falling, where to look first.
So during the analytics phase, we combed through all the widget's charts. We looked for clear ways to display data. For example, we discovered "Japanese candlesticks" — a trading standard that allows you to instantly read market dynamics. And of course, we thoroughly studied the T-Bank terminal dashboard itself. So that each of our proposals would fit organically into the overall logic, and the mechanics wouldn't conflict with each other.
Finally moving on to design
The widget was conceived as the main entry point into the world of bonds. You immediately see current rates, can go to the market overview, look at tops for Russia and other countries — everything at hand.
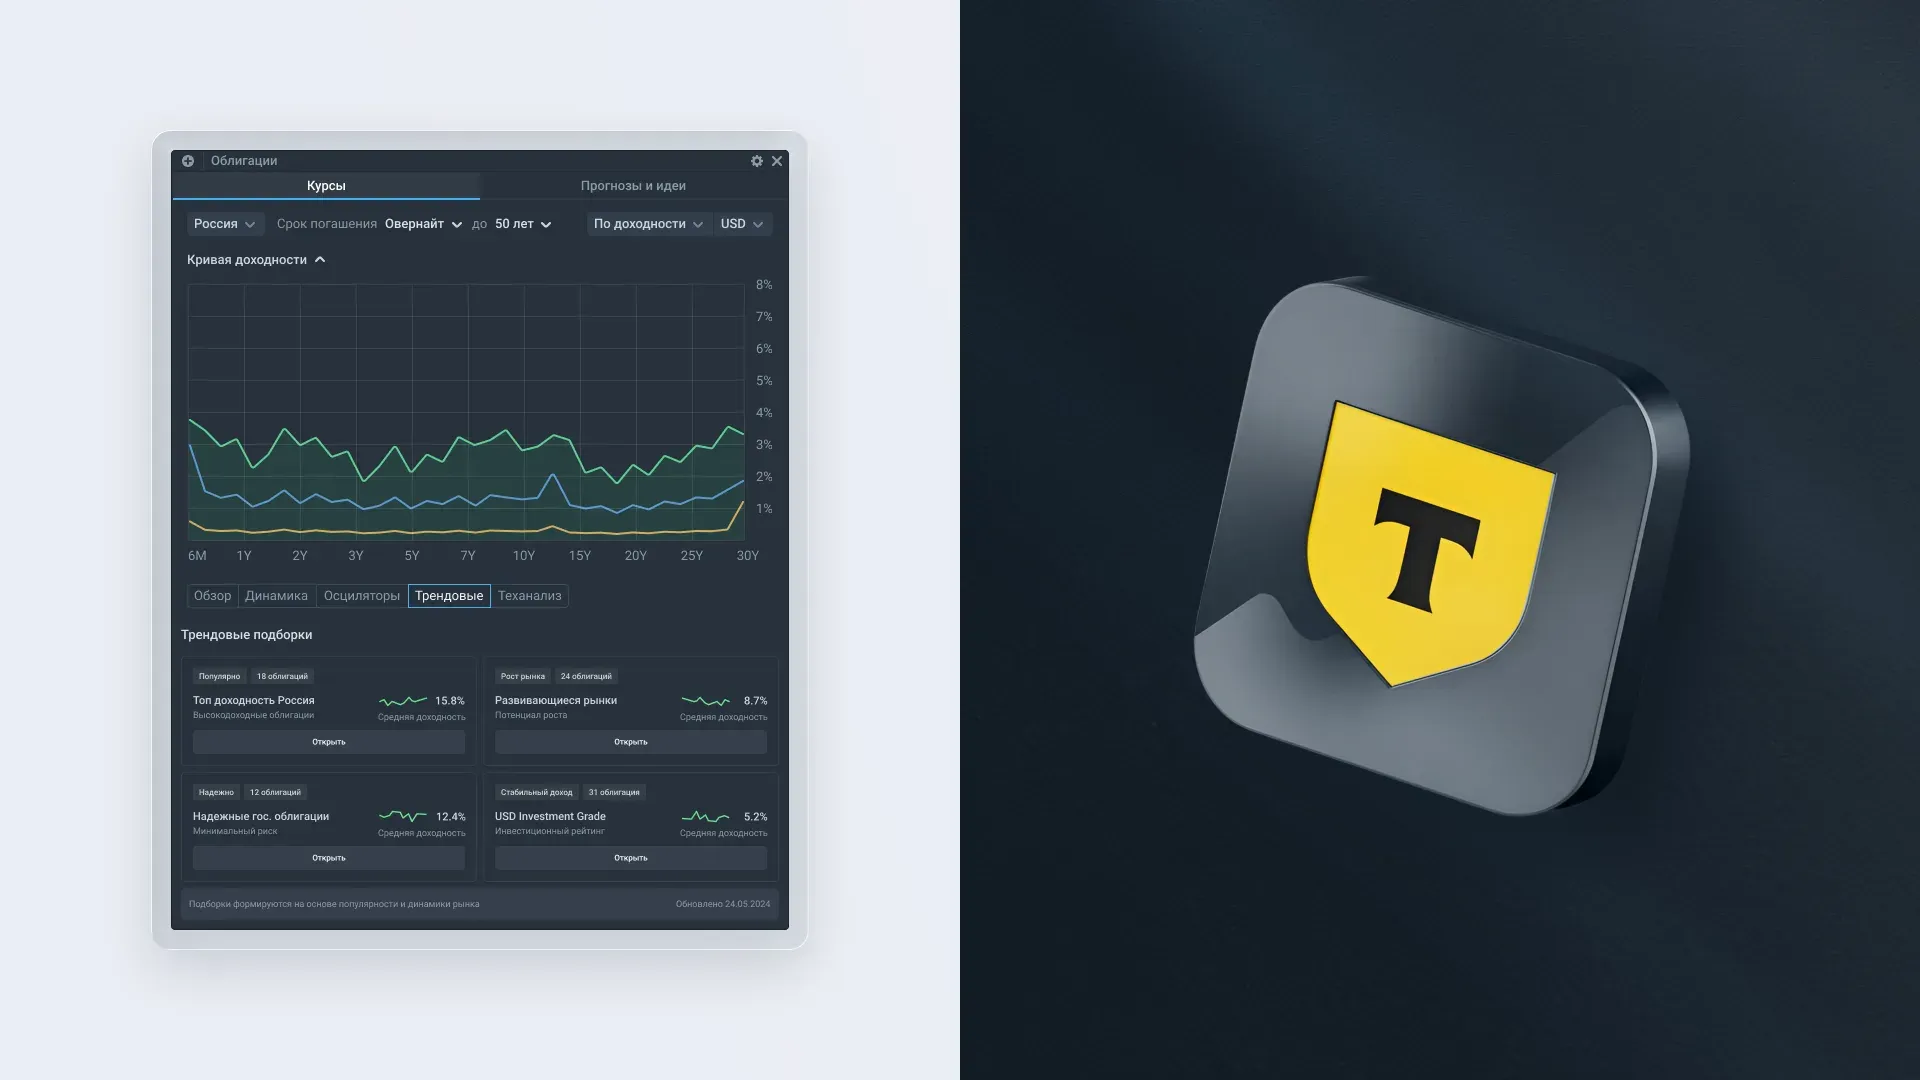
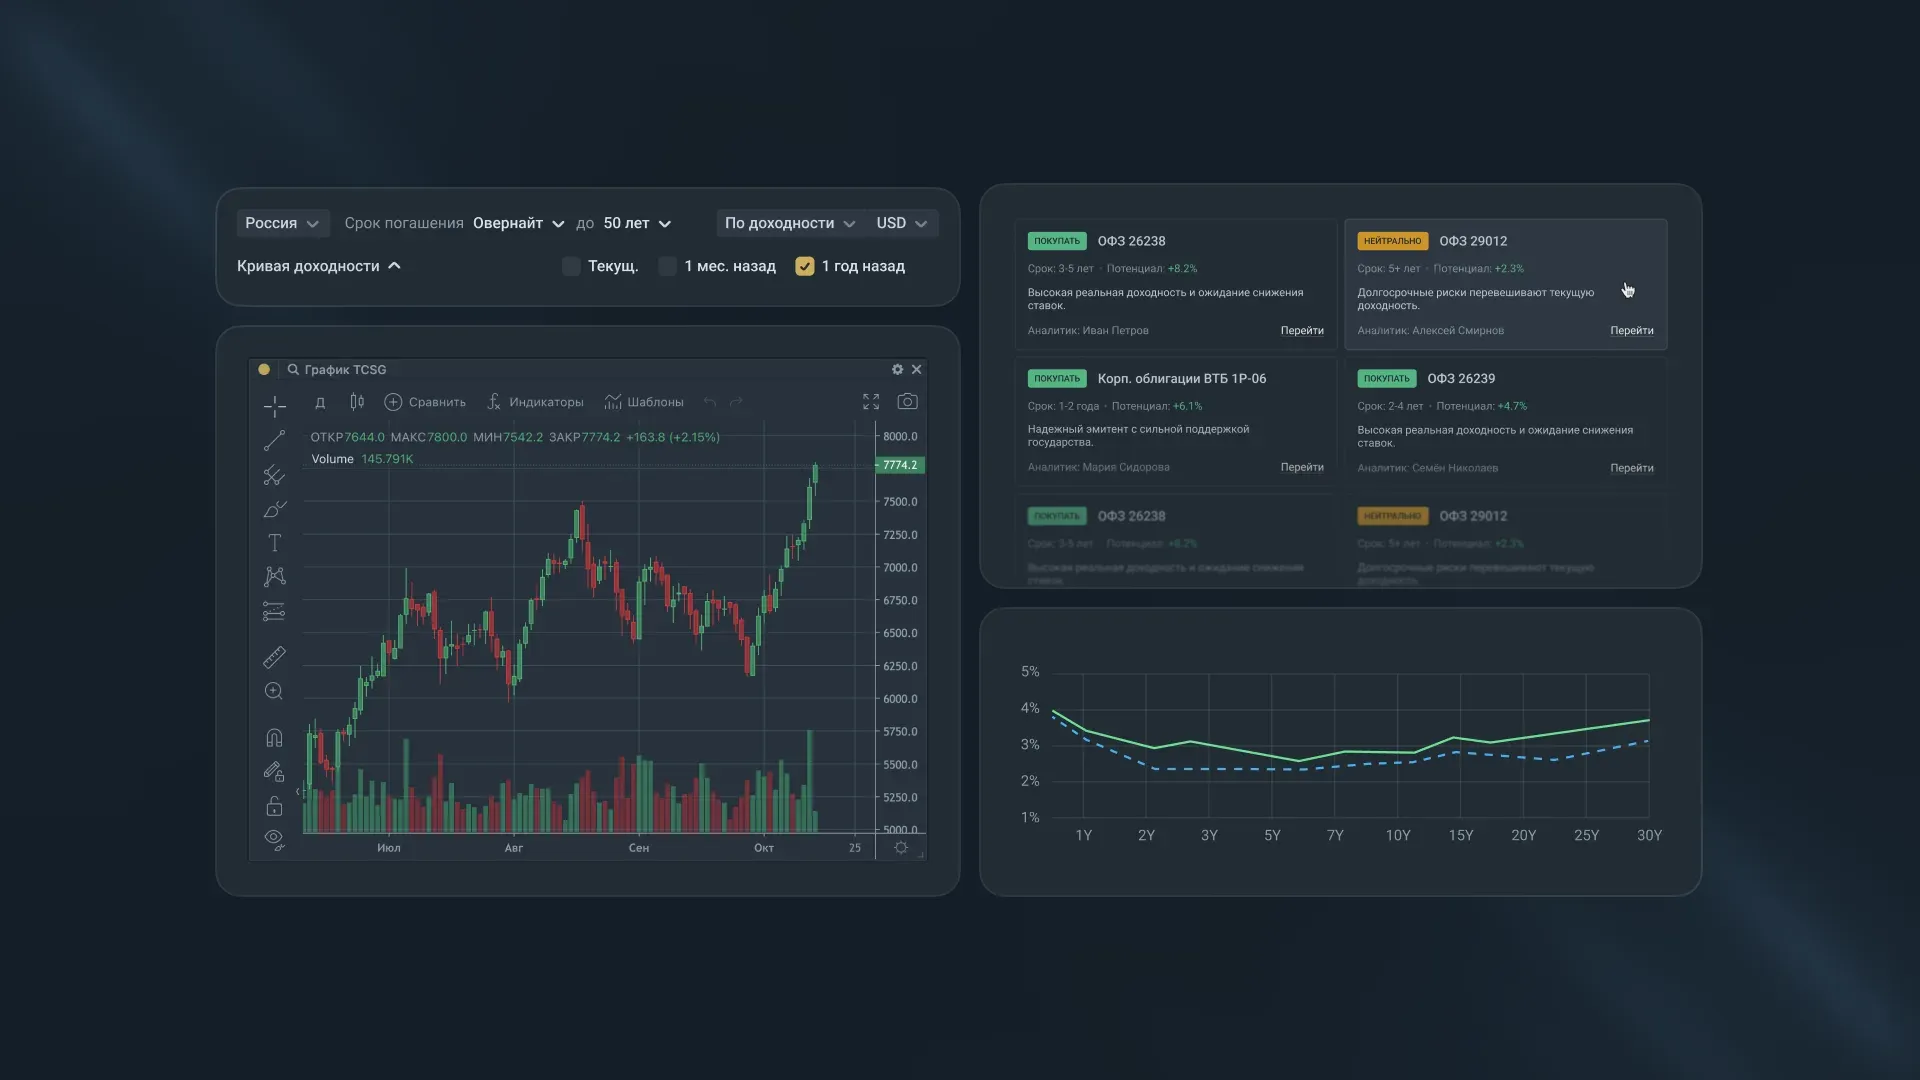
Filtering is a separate story. We made it flexible and unobtrusive: configure the output by maturity, yield, currency, any other parameters. And if you want to see dynamics — switch the time period. A month ago, a year ago — compare and draw conclusions.
Market visualization is a separate powerful module. In the widget, you can not just look at numbers, but actually analyze dynamics, track trends, work with charts and technical analysis. Find support and resistance levels, evaluate entry points.
To get a complete picture, we created several levels of depth:
1. Quick overview (top bonds);
2. Dynamics and trends;
3. Technical analysis elements.
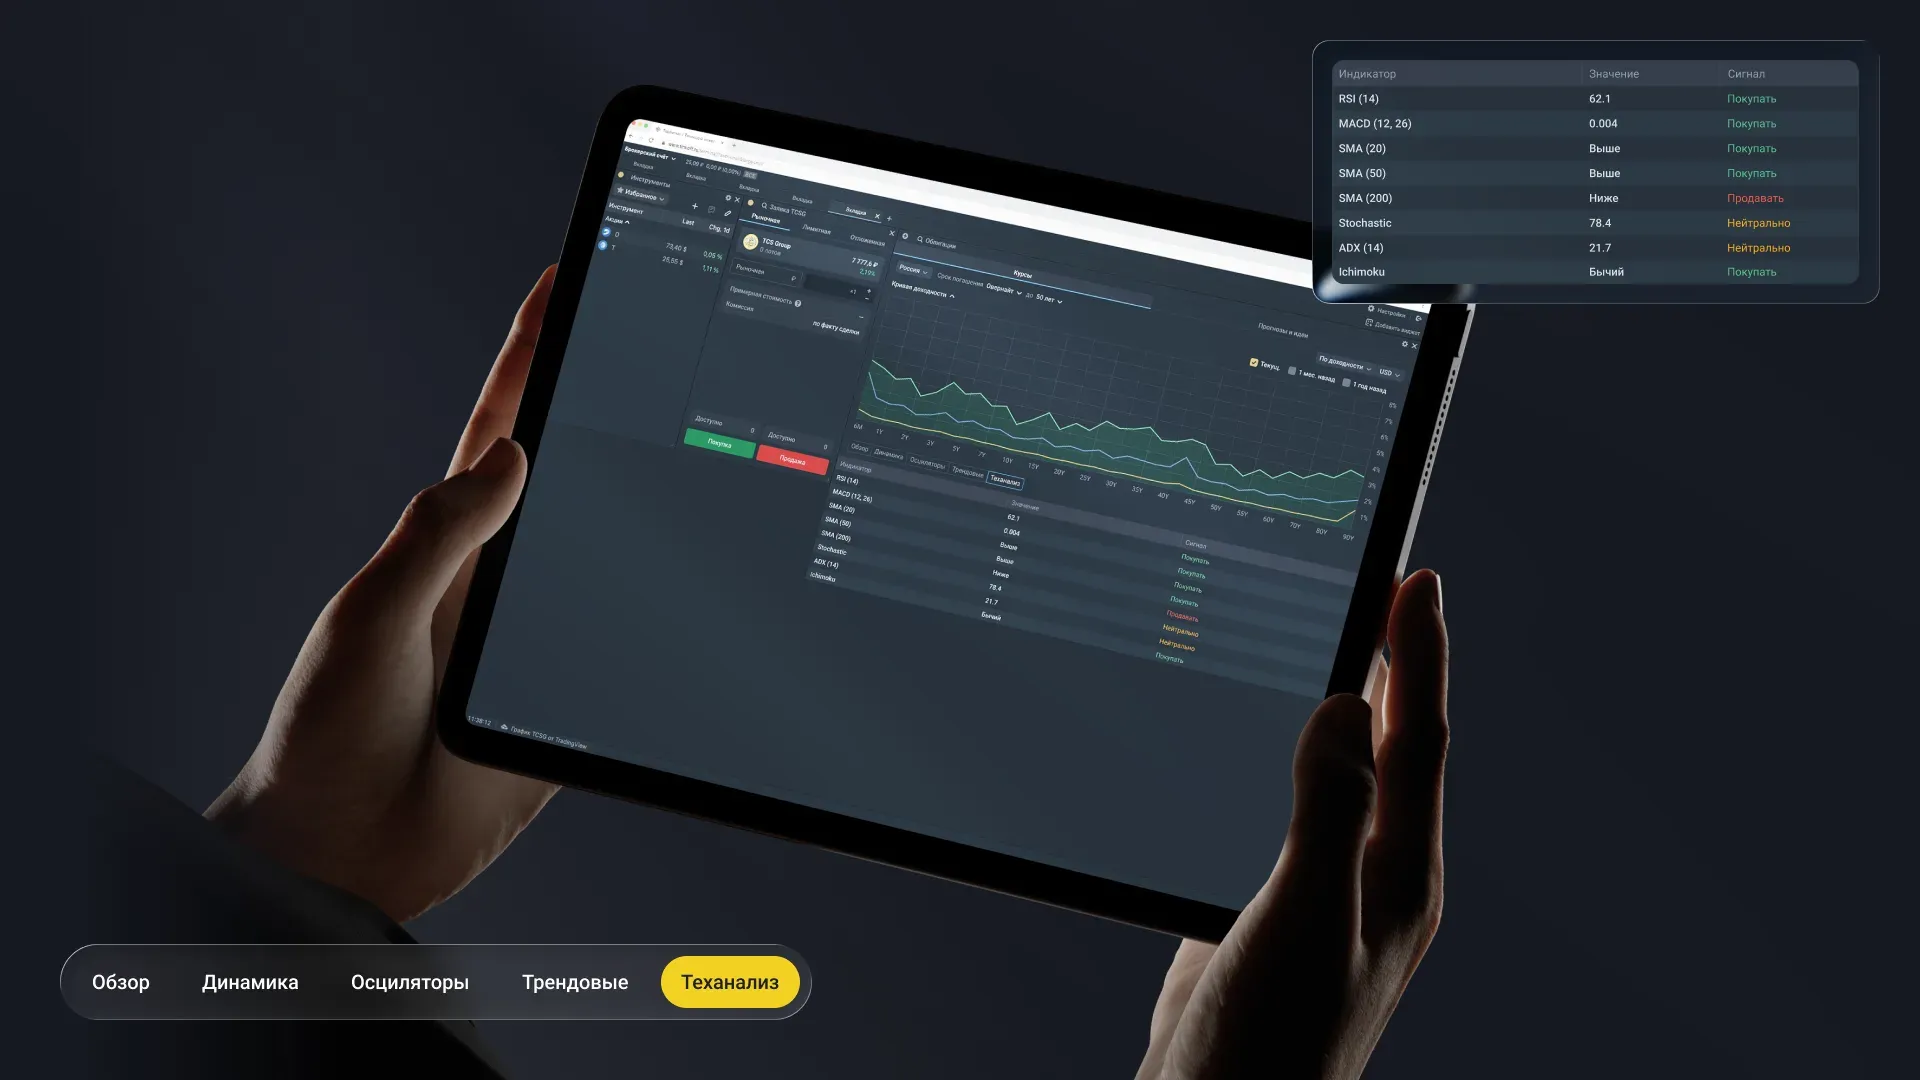
The main advantage is aggregation. Usually an investor sits in several services at once: charts here, news there, analytics elsewhere. We collected everything into a single dashboard. A quick market snapshot – and decision-making time is reduced many times over.
Plus we built in potential for growth. Already at the concept stage, we provided space for forecasts and investment ideas: thematic selections, market summaries, buy or sell signals. This is the next logical step – helping the user not only analyze, but also interpret data. Now our hypotheses match perfectly with developing AI assistants.
Even without full implementation of forecasts and ideas, we partially addressed this need with the "Rating" column. A simple thing – but it gives the user a quick reference point: which bonds look attractive, and which rather deserve attention for selling.
Results
Our task was to set the direction and build a foundation that the T-Investments team could rely on going forward. We handled that.
And then something special happened: one of our designers, after the project ended, joined the product team and continued developing the widget from the inside. Context wasn't lost, the logic of decisions didn't fall apart – a rare scenario when everything came together.
What happened to that widget later is not exactly known. Most likely, the bond functionality was eventually implemented, but in a reworked form – for new priorities and development.
Now the terminal has grown noticeably. AI tools have appeared there that help with analysis and decision-making – that very direction we were sketching out as hypotheses back at the start. It's nice when your ideas don't die, but materialize years later.